 AI Host Assistant
Docs · Guide 11 of 14
Multicalendar, year view · “Golden window”
Golden window
How far ahead did your nights sell best? From last year’s reservations and each one’s payout breakdown, it measures at what lead time your nights were best paid, net of month, weekday and length of stay, and how much to trust the figure.
- Where
- Your Airbnb multicalendar, year view: the “Golden window” button in the year row. It opens a strip under that row; “See analysis” opens the full report.
- What it reads
- Your reservations of the last 365 days and each one’s payout breakdown, the lead-time discounts in your Airbnb pricing settings and, once a listing is measured, one snapshot of its calendar a day.
- What it costs
- No AI call. Measuring reads your reservations list and then each breakdown, one request at a time: a few minutes. Breakdowns already read are saved and not asked for again.
- What it changes on Airbnb
- Nothing. It does not touch your prices.
The problem
When someone books two or three months ahead, do they pay you more or less than someone who books at the last minute? Your calendar does not say. And looking at it booking by booking is misleading: a night in December does not compare with one in February, nor a Saturday with a Tuesday, nor a two-night stay with a seven-night one.
Where to find it
Open your calendar on Airbnb in the year view, the only one with the year row. Next to the Booking window switch is the “Golden window” button, which works on the listing you have open. Press it and a strip appears above the months. The first time, it only tells you what it looks at: how far ahead your nights sold best.

The × hides the strip, and the button brings it back. It only asks you to be signed in (see Account and settings): nothing goes to any AI.
Measuring
“Measure my golden window” first reads the list of your reservations and then, one by one, what was paid for each reservation, to separate the nights from the cleaning.

It goes slowly on purpose, with a pause between requests so Airbnb does not throttle it, and the full measurement takes a few minutes. You can stop it whenever you like, and what it has read is kept. When it finishes, the result is saved for this listing, in this browser.
Each reservation becomes nights: what was charged for the nights and extras, before Airbnb’s fee and without cleaning or taxes, spread evenly over the stay. Each night is compared with similar nights (same month, kind of day and length of stay) booked 15 to 29 days ahead: the point of comparison. Cancellations, very long stays, courtesy stays and breakdowns that cannot be read or do not add up are set aside and counted, never filled in.
The strip
With a measurement saved, the strip gives the answer in a single band. On the left, your golden window, in days before check-in. Next to it, how much more per night the nights booked that far ahead were paid, on average, against booking two to four weeks ahead, with how many reservations and nights stand behind it; the bar is its likely range.

Then what to do: raise by up to 12% what is booked in that window. In red, what is worth checking: the lead times that paid clearly less. The small curve is that difference day by day, from 0 to 180 days: in gold, your window; in red, where you charge less. “See analysis” opens the full report, and “Measure again” measures from the start.
The report: the answer first
At the top, the answer: your golden window and how much more its nights were paid per night, on average. Next to it, how far to trust it: the likely range and the sample. When the range is wide, it says so plainly: a rough figure. The direction is clear, the exact figure is not.
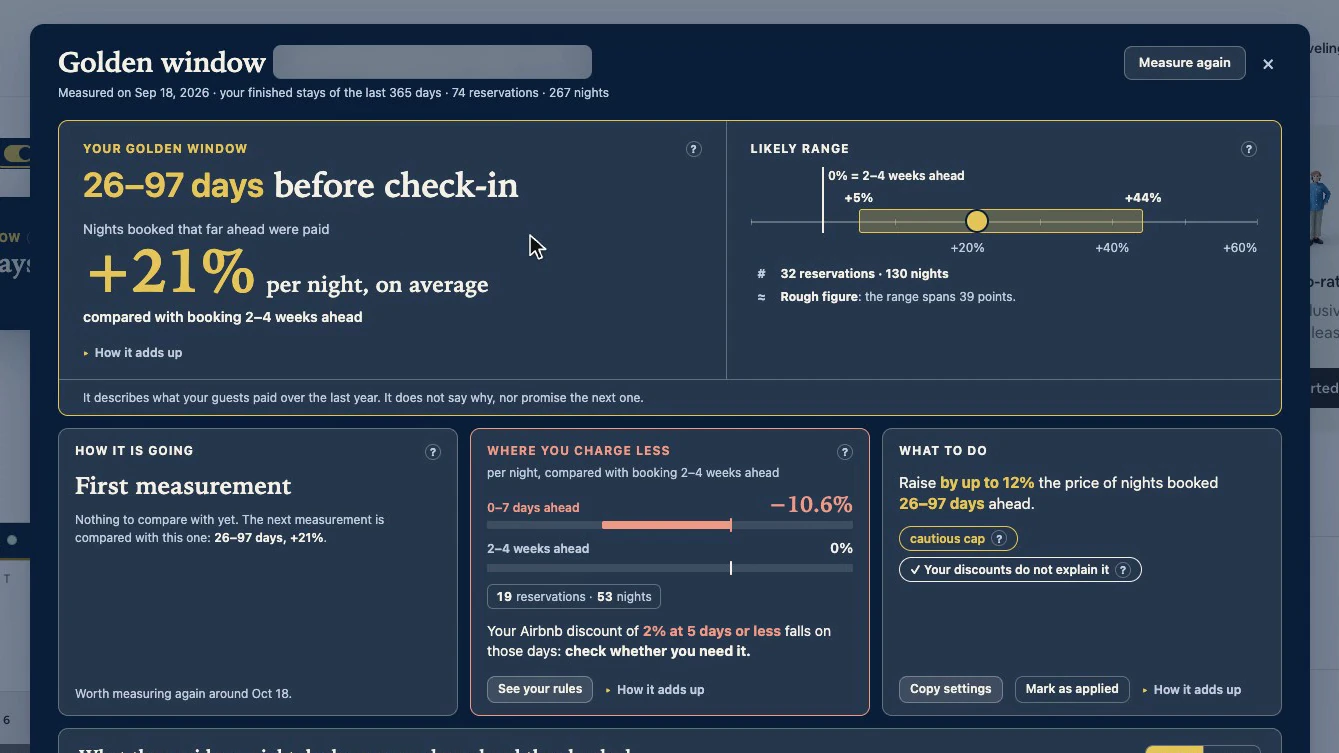
Below, three cards:
- “How it is going”: the first measurement has nothing to compare with yet; the next one is compared with this one, and the card says when it is worth measuring again. Nothing measures again on its own.
- “Where you charge less”: the lead times that paid clearly less, with their reservations and nights. If your Airbnb last-minute discount falls on those days, it asks you to check whether you need it; “See your rules” takes you to them.
- “What to do”: raise by up to 12% the price of the nights booked in your window, with two tags. “Cautious cap”: its question mark explains that the 12% is a fixed cap that does not come from your data; as long as it cannot be ruled out that those dates were better in themselves, it will not suggest raising by all that was measured. And whether your discounts explain the difference.
“Copy settings” puts the text on your clipboard, for your pricing tool: the extension does not touch your prices on Airbnb; that is your call. “Mark as applied” only notes the date, in this browser. Each card’s “How it adds up” shows the maths: what was measured, the cap, the smaller of the two, and the exact text that gets copied.
The chart, day by day
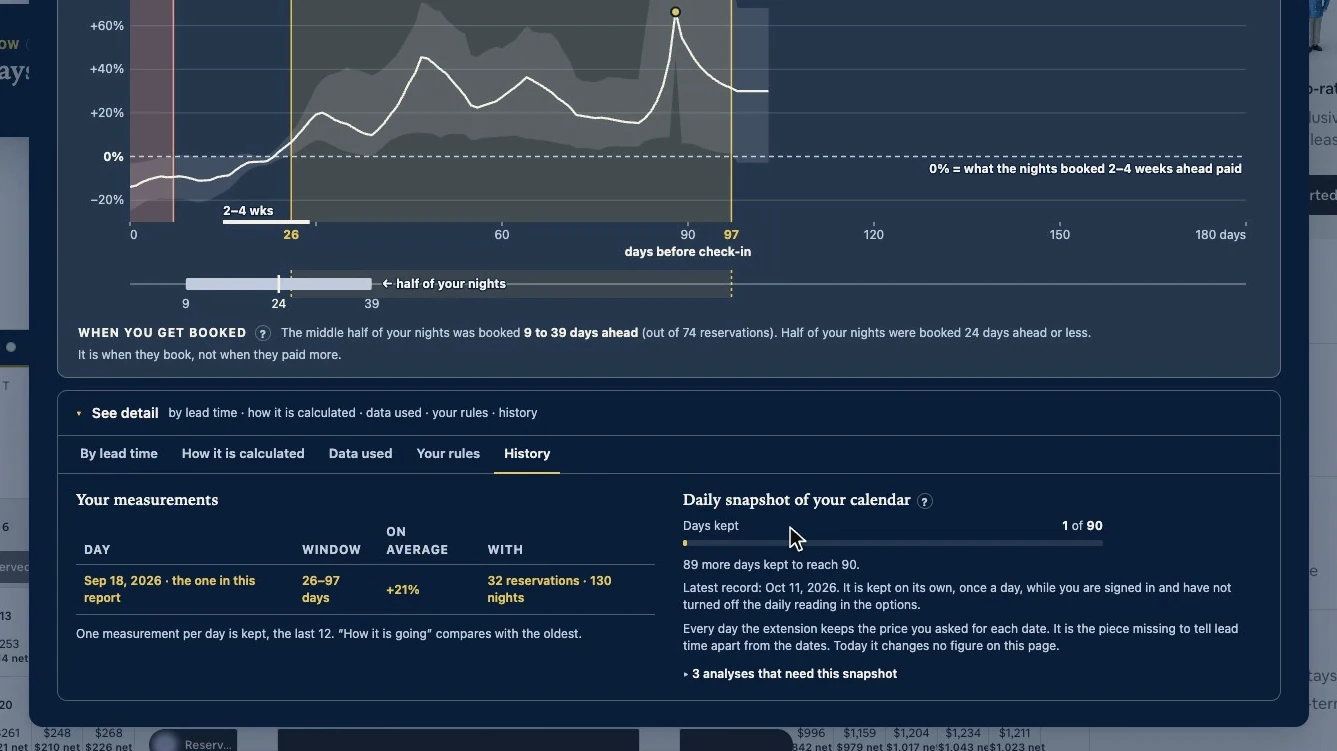
Below, the chart: what they paid per night by how many days ahead they booked. The zero line is booking two to four weeks ahead; in gold, your window; in red, where you charge less.
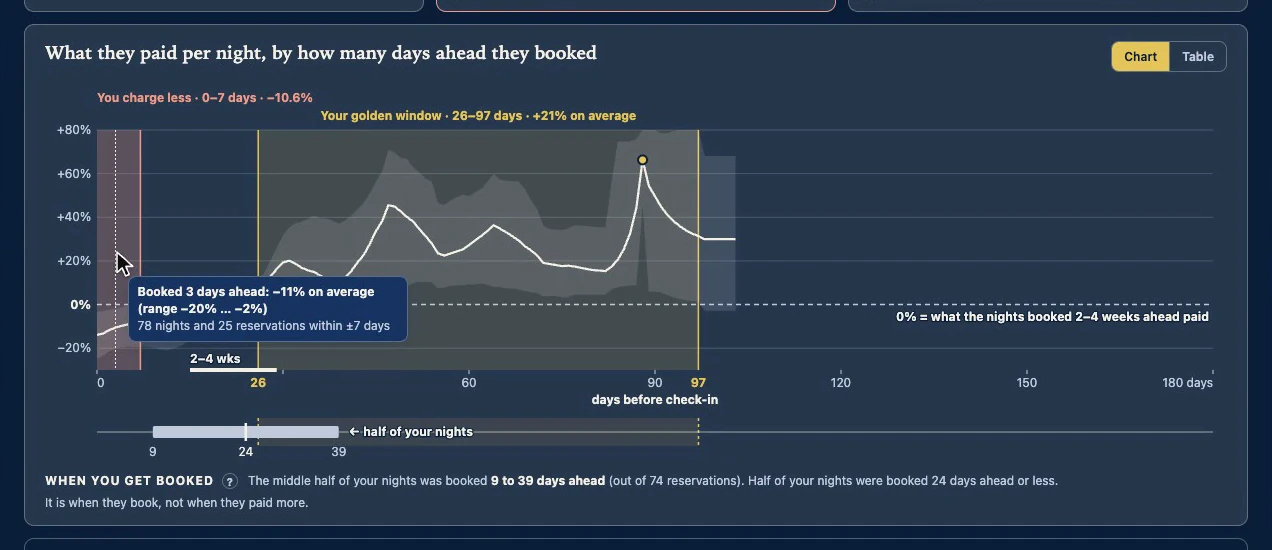
Hover over a day and it gives you that day’s value and how many nights support it. A peak can rest on a single reservation: that is why the whole window counts, not the peak. Where there are no nights, the curve makes nothing up. Underneath, on the same axis, when you get booked: the middle half of your nights. That is when you get booked, not when you are paid best; the Booking window tells you that too. “Table” shows the chart as numbers.
See detail: five tabs
Everything else is in “See detail”, in five tabs.
“By lead time” groups your reservations by how many days ahead they were made, and compares each row with the point of comparison, booking 15 to 29 days ahead, which is zero. A row whose whole range is above zero paid more; if the range crosses zero, there is no clear difference. “Possible seasonal effect” marks a row with part of its nights in months that share a seasonal adjustment with another month. Where there are too few reservations, there is no figure: it says how many reservations and nights it is short.
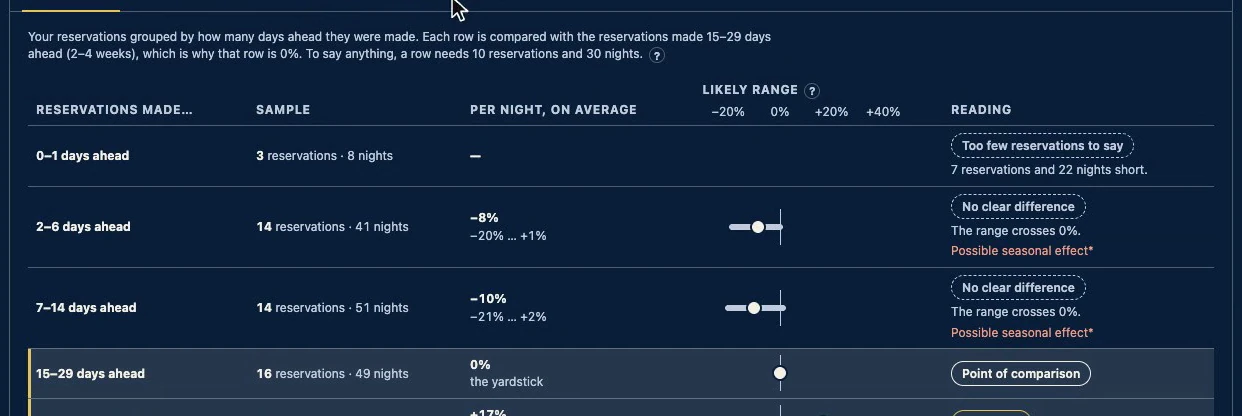
A note explains why the window does not match any row: it comes from the day-by-day curve. Where you charge less comes out the same way, which is why it can be clear even when these rows are not.
“How it is calculated” shows the maths in five steps and ends with what the analysis cannot tell you. “Data used” says where each figure comes from: how many reservations are used and why the others were left out; whether your year had two different Airbnb fees, which the maths keeps apart (see Net after 15.5%); and that the breakdowns in the analysis match Airbnb’s list to the cent.
Your rules
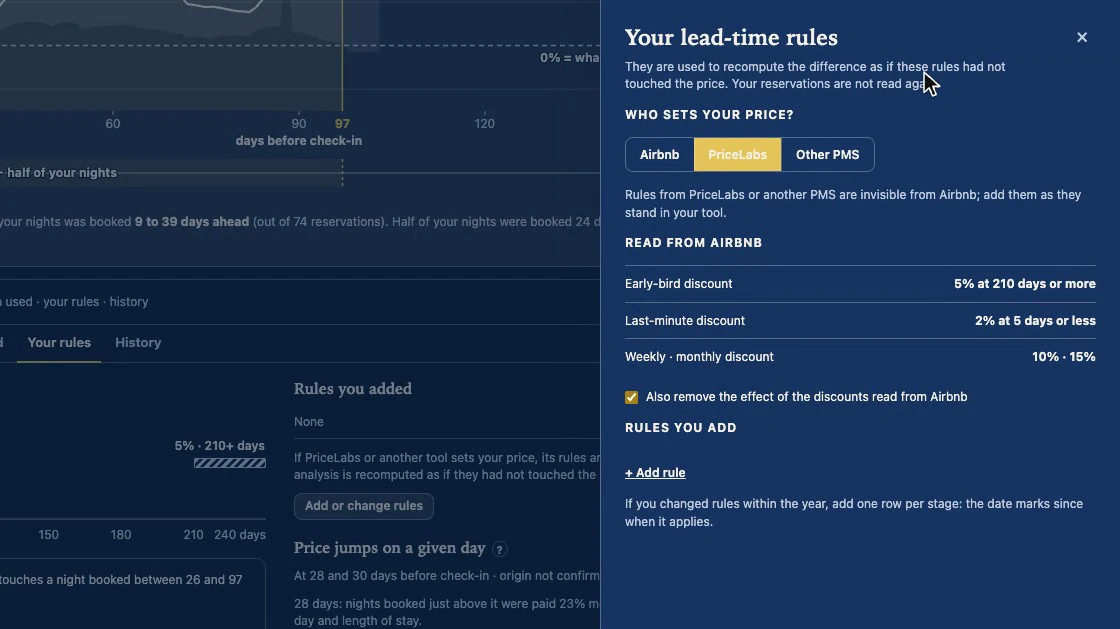
“Your rules” checks whether your Airbnb discounts explain the difference: the difference is recomputed as if your lead-time discounts had never touched the price, and if it survives, they do not explain it. It also flags price jumps on a given day before check-in, which fit a rule that starts there but are not confirmed.
If PriceLabs or another tool sets your price, its rules cannot be seen from Airbnb. “Add or change rules” opens “Your lead-time rules”: first, who sets your price; then what was actually read from Airbnb for your listing; and below, the rules you add. The analysis is recalculated with them without reading your reservations again.
History
“History” keeps your measurements and the daily snapshot of your calendar. Airbnb does not keep what price you were asking each day, and that is what is missing to separate lead time from dates: the extension records it on its own, once a day, while you are signed in and have not turned off the daily reading in the options. It tells you how many days it has of the 90 it needs. There are three analyses that need it, and they have not been done yet.
Why it works
It compares each night with similar nights from your own year, using what was actually paid for the stay. It tells you how much to trust the figure, and it fills nothing in by guesswork.
Its limits
- It describes what already happened. It does not promise what will happen.
- It does not yet separate lead time from dates: the dates that get booked early may be dearer in themselves. Hence the 12% cap.
- Rules from PriceLabs or another tool only count if you add them.
- With few reservations the range widens and rows go without a figure; if no lead time stands out, the strip says so.
- It only measures again when you ask it to. The rest is up to you.