 AI Host Assistant
Docs · Guide 10 of 14
Multicalendar, year view · “Market pulse”
Market pulse
Are you getting your share of the demand? Market pulse sets your occupancy against that of the listings Airbnb considers similar to yours, with the numbers from Airbnb’s own performance dashboard, and sums it up in one index: the MPI.
- Where
- Your Airbnb multicalendar, in the year view: the “Market pulse” button in the year row brings a row of months under the year, and the full screen opens from it. And a “Market” tab inside every Month insight you open.
- What it reads
- Airbnb’s own comparison with similar listings, from your performance dashboard: your occupancy and theirs, and both average rates.
- What it costs
- No AI and no OpenAI key. Only requests to Airbnb, one at a time: a few for the row, six more for “Six windows” and four for “Night by night” (three from Airbnb and one from your calendar) when you open those tabs, two for each period on the full screen, and two or three for each month you open.
- What it changes on Airbnb
- Nothing. It only reads.
The problem
Your occupancy alone doesn’t tell you whether a month went well: a full month can be one when everyone filled up, and a slow one can be slow for everyone. The missing half is how listings like yours did over the same nights. Airbnb already makes that comparison in its performance dashboard, on another page. Market pulse brings it next to your calendar as one index, the MPI: your occupancy divided by theirs. At 1.00 you sell the same share of your nights as they do. Occupancy is Airbnb’s on both sides: booked nights over booked plus unbooked, with blocked nights left out.
Where to find it
Open your multicalendar on Airbnb in the year view. “Market pulse” is in the row of the extension’s buttons next to the year. It brings, under the year, the row “Twelve months against the similar listings”. From that row you open the full screen, for one period at a time. And every Month insight you open has a “Market” tab with the same comparison for that month.

If you are not signed in to the extension, the button asks for that first. There is no AI data notice: nothing here goes to an AI. Account and settings covers signing in.
Twelve months against the similar listings
There is nothing to set up: the row reads when it opens, and says so while it reads. Each column is a month: twelve back, the running one and six ahead. On top, two bars per month, each as tall as its distance from par: gold above par, grey at par, red below. The solid one is the MPI, your occupancy over the similar listings’. The striped one is the RGI, the MPI times your average rate over theirs: your income per night against theirs. A month you sold a lot but cheaply leaves the striped bar below the solid one. The RGI needs at least 3 booked nights that month; if Airbnb’s percentage does not prove it, the row counts them with one more read, and if it can’t, a dash goes beside the solid bar with its reason on hover. Underneath, your occupancy and the similar listings’ that month, according to Airbnb.
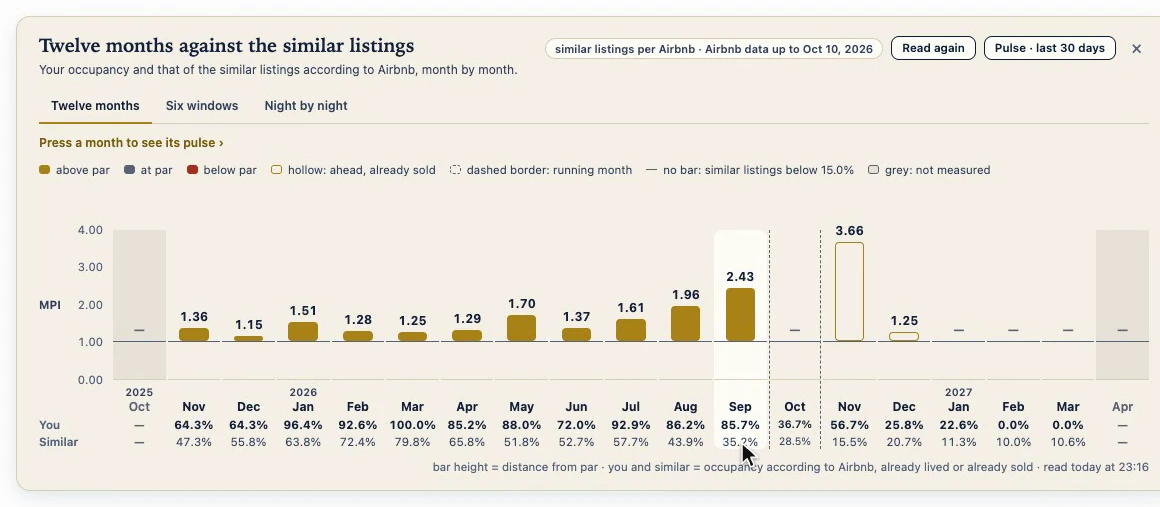
What can’t be measured isn’t made up, and the legend says so by shape. The months ahead get hollow bars: it is what is already sold today, on both sides, and it changes every day. If a month ahead’s card sees that the nights Airbnb counts don’t match your calendar, that month goes grey in the row, as on the card. The running month sits between dashed borders, with no bar: it would mix nights already gone with nights still to sell. A month where the similar listings are below 15% gets no bar either: dividing by almost nothing means nothing. And in grey, what Airbnb doesn’t compare: more than a year back or more than six months ahead.
At the top, a chip says where it all comes from, “similar listings per Airbnb”, and the day Airbnb’s data runs up to. Next to it, “Read again”, which asks only for what the row shows, and “Pulse · last 30 days”, which opens the full screen. The × tucks the row away; the button brings it back.
Six windows
A whole month is a long time. The second tab, “Six windows”, looks closer, and it reads when you open it: six more requests. Six stretches around Airbnb’s last day with data: the last 30, 15 and 7 nights, which already happened, and the next 7, 15 and 30, with what is already sold. One dot per stretch, against the par line; a hollow dot has fewer than 15 nights with data, too small a sample to rely on.
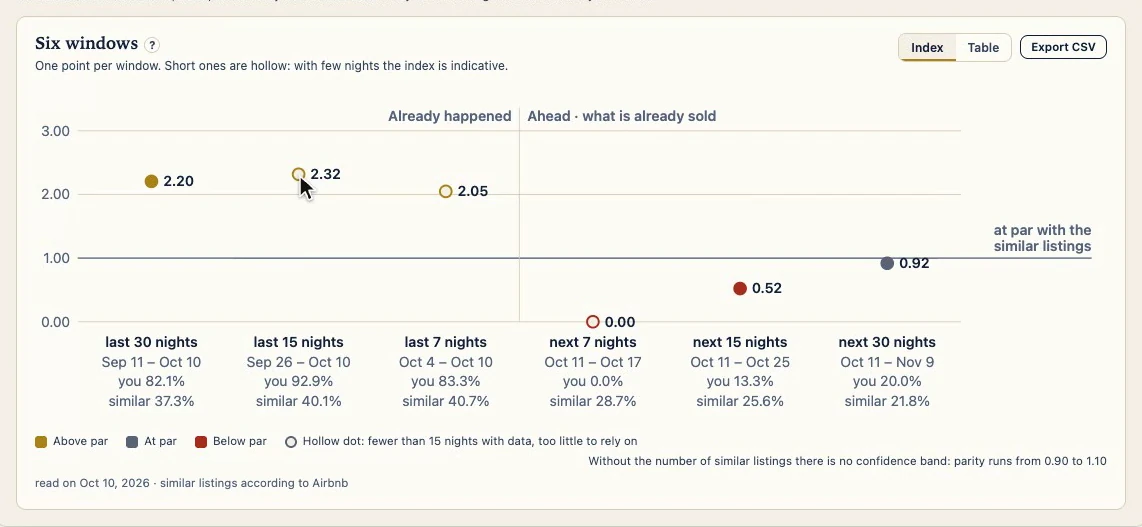
“Table” shows the same six in numbers, with how many nights you booked out of the ones Airbnb counts. “Export CSV” downloads the windows and each night, with no prices.
Night by night
The third tab answers the most concrete question: which nights are you still not selling while the similar listings fill up more than is normal for them? It also reads when you open it. The curve is their occupancy, night by night. Your nights are squares, because each one is either sold or not. The dashed lines are their median on each side, and the gold marks point to your unsold nights where they went above it. Underneath, the date of each night; hover over one and it shows its figures. Your squares follow your calendar: Airbnb’s dashboard catches up in batches, and a night Airbnb still counts differently has a marked corner, with a note saying which ones.
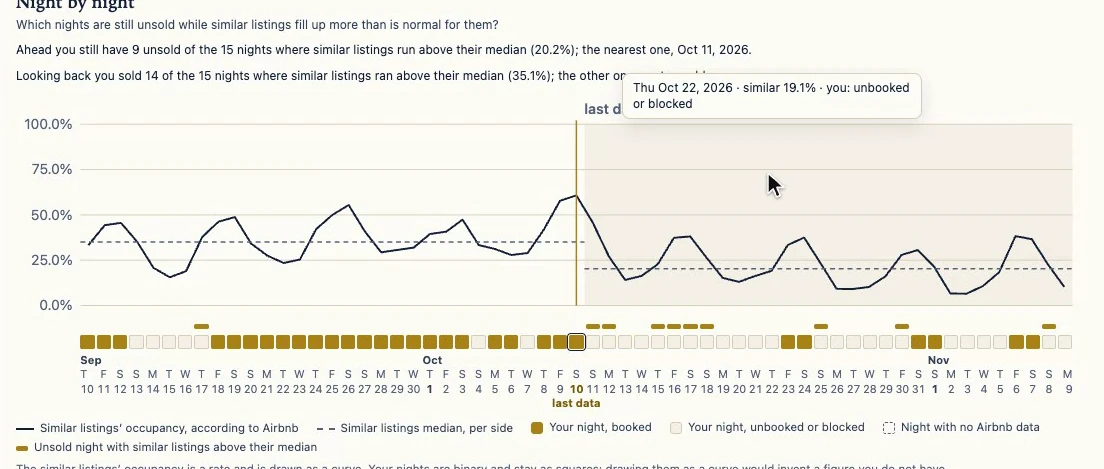
Two sentences answer it: how many of those nights you still have unsold ahead, and the nearest one; and how many you sold looking back. With a caveat in writing: the similar listings filling a night doesn’t mean you could have sold it, or at what price.
The full screen: one period, five cards
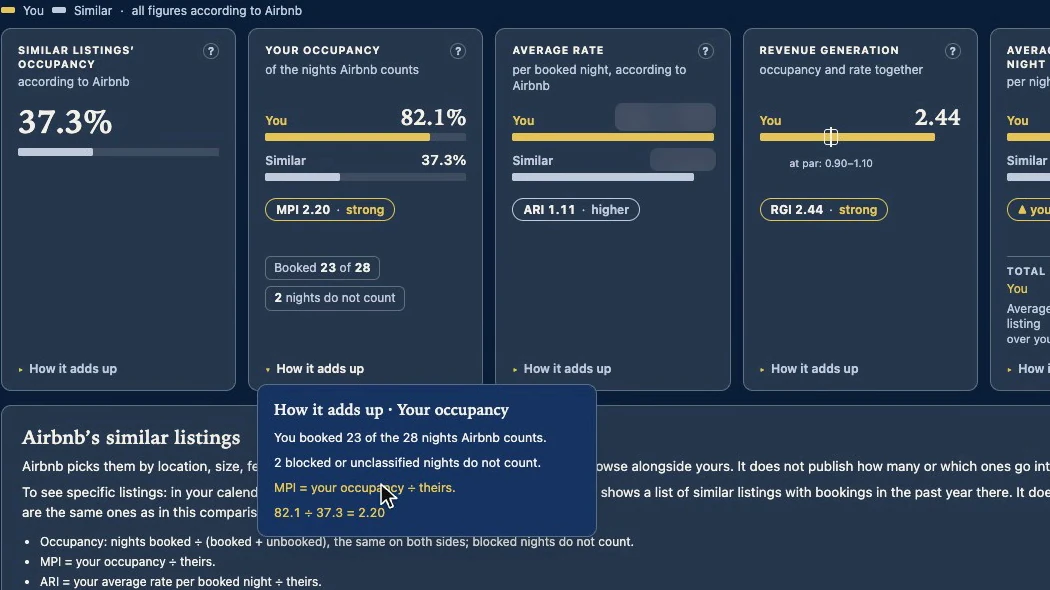
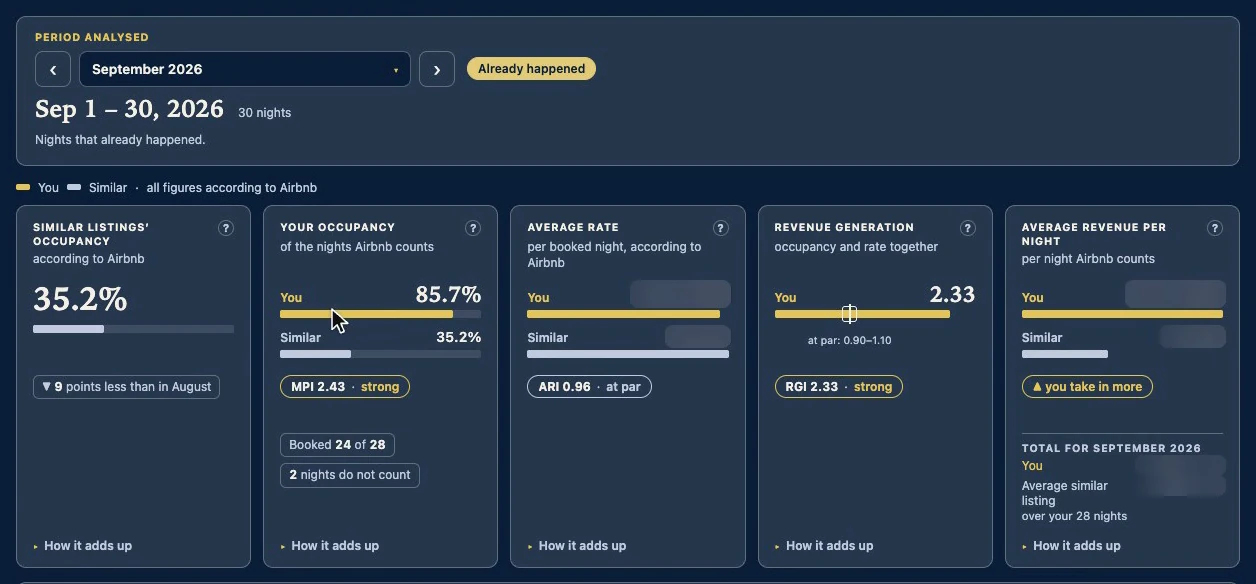
To look at a whole period there is the full screen. “Pulse · last 30 days” opens it on the last 30 days, with two requests to Airbnb, one at a time. At the top, the period analysed, with its dates in large type and whether it already happened or is what is already sold. Below, five cards on that same period, with bars on the same scale: you on top, in gold; the similar listings underneath.
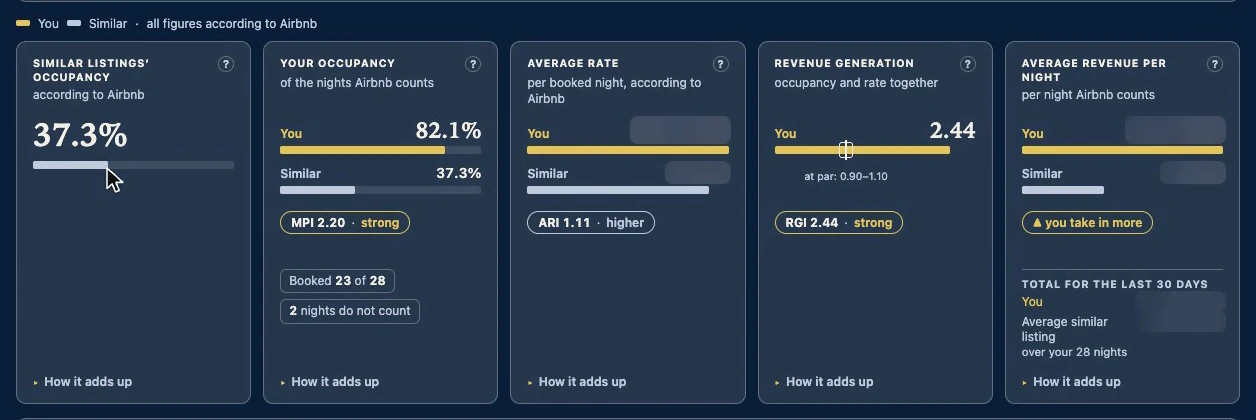
- The similar listings’ occupancy.
- Your occupancy against theirs, with the MPI and its verdict, and how many nights you booked out of the ones Airbnb counts.
- Your average rate per booked night against theirs. Its index, the ARI, is always grey: charging more or less isn’t good or bad on its own, so it only says higher, at par or lower.
- The RGI puts the two together: the MPI times the ARI. Without knowing how many similar listings there are, there is no confidence band, so par is read wide: from 0.90 to 1.10.
- The same in money: the average revenue for each night Airbnb counts, on each side, and the total for the period. It comes from Airbnb’s average rate, not from your payouts: it is not what you keep.
Each card’s “?” says what its acronym stands for, and “How it adds up” shows the maths with its figures, so you can check it by hand.
A month from the row
Every month in the row opens this same screen on that month. The period is in a selector, with ‹ › to step through: the last 30 days, any month in the row, or the running month’s two halves. For a month that is over, the first card also compares the similar listings’ occupancy with the month before.
In each Month insight
In the calendar, every month has its own card, the Month insight. Under “Money”, occupancy shows up twice: Airbnb’s, the same one the MPI uses, and the visual one, your occupied nights over every night in the month; underneath, how many nights Airbnb divides by. Under the “Market” tab, its comparison: the similar listings’ occupancy and your MPI with its verdict.
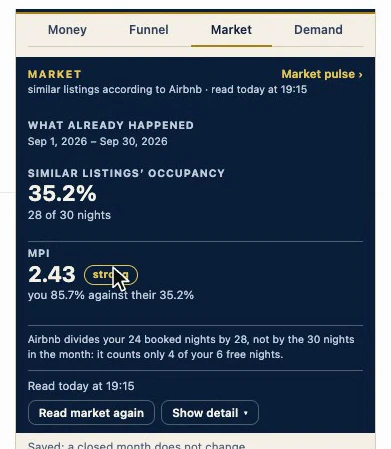
“Show detail” lays it out item by item: how many nights Airbnb counts, your nights according to Airbnb and the ones it places in none of its groups, the verdict, the month’s price and the day the data runs up to. The tab’s “Market pulse ›” link opens the full screen on that month, starting on what already happened; the arrow takes you to what is already sold, and the five cards change with it.
The running month
The running month has no single index: there are two figures, never averaged. “What already happened”, from the 1st to Airbnb’s last day with data, and “What you have sold”, from there to the end of the month, as of today; it changes daily.
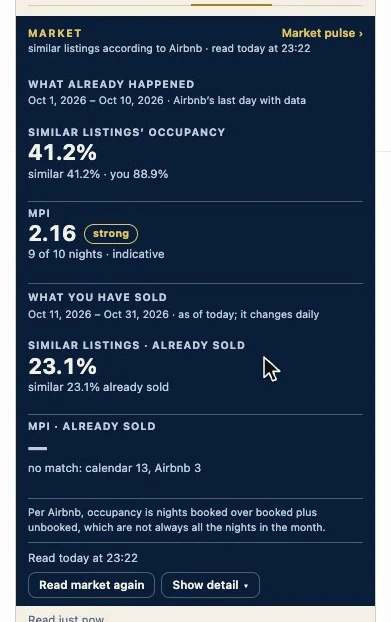
At the bottom, the time it was read, and “Read market again” to ask Airbnb once more. If Airbnb’s dashboard hasn’t yet counted a booking your calendar already has, it says so, “no match” with both counts, and gives no index until they match. Airbnb updates that dashboard in batches, so reading again does not always fix it.
Why it works
Both sides come from Airbnb, with the same definition of occupancy, over the same nights and read on the same day. So a month that was slow for everyone does not show up as your failure. And what it doesn’t know, it says.
Its limits
- Airbnb decides who the similar listings are and does not publish how many. The extension does not choose them.
- Anything ahead is what is sold today, on both sides. It changes every day, and it is not a result.
- The index measures the gap; it doesn’t say where it comes from. For causes, there are other tools, such as Listing signals.
- It saves nothing to Airbnb.