 AI Host Assistant
Docs · Guide 8 of 14
Multicalendar, year view · “Year in numbers”
Year in numbers
Twelve months at a glance, each with its own receipt. It puts every month of the year side by side in one panel, with the same receipt each Month insight prints, and shows what it does not know yet as a gap.
- Where
- Your Airbnb multicalendar, in the year view: the “Year in numbers” button in the row with the year.
- What it reads
- Your payout history for the year, each month’s calendar and reservations, Airbnb’s own occupancy for each month, your reviews and how many listings your account has. Each reservation’s breakdown and the funnel pages, only when you ask.
- What it costs
- No AI call. Reads of your own Airbnb data, one at a time and only for what has not been read yet. The breakdowns and the funnel, which are dozens of reads, only when you press their button, which tells you how many first.
- What it changes on Airbnb
- Nothing. It only reads.
The problem
Every month in your calendar already has its Month insight. But what you want to know is hardly ever one month on its own: whether August was good or just normal, how much you kept this year once the cleaning is taken out, what you have booked for the rest of the year. For that you would have to open twelve cards, one after another. And Airbnb’s payout figures include the cleaning.
Where to find it
Open your multicalendar in the year view. “Year in numbers” sits in the row with the year, so it only exists in that view. The button next to it, “Days of the week”, is a different tool: it groups your past nights by Monday, Tuesday, Wednesday… This one goes by the months of the calendar year, including the ones still to come.

If you are not signed in to the extension, the button asks for that first. It sends nothing to an AI, so it needs no OpenAI key and shows no data notice. Account and settings shows how to sign in.
It opens with what is already known
The panel opens right below the year row and pushes the calendar down: it is part of the page, not a window. It draws at once with what is already known, at first only what the calendar itself shows.
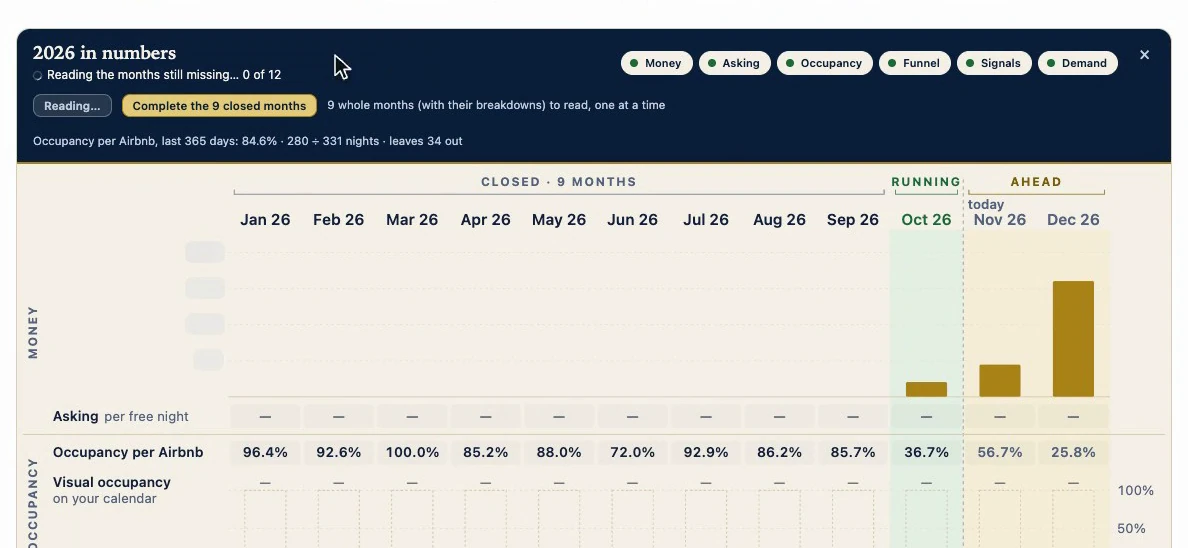
Behind the scenes it reads the months still missing, one at a time and at an unhurried pace; the header says how far it has got. A month not read yet shows dashes, never zeros. Separately, it asks Airbnb for its own occupancy for each month. If you close the panel, it stops reading; after three months in a row with nothing, it stops too. What it read for closed months is kept for next time.
How to read it
Twelve columns, January to December of the year you had on screen when you clicked. On top, three brackets: the closed months, the running one, and the ones ahead. The “today” line separates the running month from the ones to come.
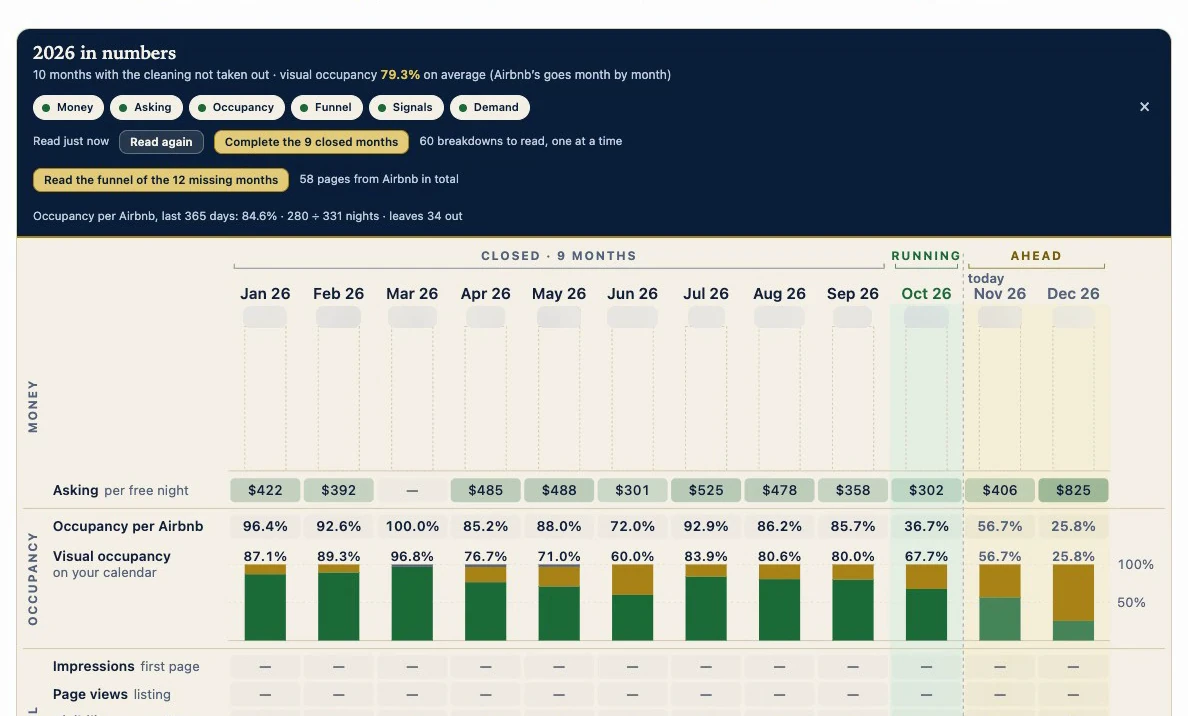
Running across are the lanes: money, occupancy, funnel, signals and demand. The chips in the header turn each one on or off, and the asking-price row too.
Money: the same receipt, by payout date
The money lane does no math of its own: each column is the same receipt its month’s insight prints. To take the cleaning out, it needs each reservation’s breakdown. Without it, it does not draw a bar as if it had it: it leaves a dashed gap, with Airbnb’s total on top.
The legend says what goes in its place. In green, “left for you”: what Airbnb pays minus each reservation’s cleaning. On top, in gold, “unsold”: what you ask for the free nights, minus a fee. The fee is the one on a reservation made today, while those nights can still be booked; in a closed month, the one its own reservations paid, once it is known.

And notice what it says about dates: money is counted by payout date, not by stay date. What you see in a month is what Airbnb paid you, or has yet to pay you, that month, even if the nights belonged to another.
A gap that says why
Hover over a column and its card pops up: the month’s receipt in miniature, with the same words as the Month insight. Here the cleaning row says why it was not taken out: the reservation breakdowns are not available. That is why the total is called “Airbnb’s total” and not “left for you”.
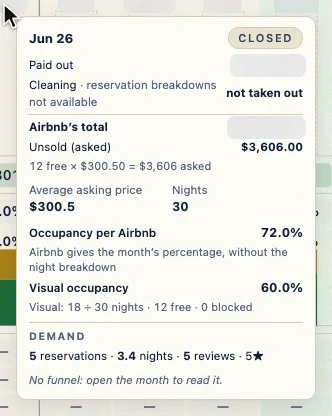
Below come the average asking price and the nights, the two occupancies, each with its name, and the demand. Where there is no funnel, it says so: open the month to read it.
Completing the closed months: the cost first
A closed month is missing the breakdowns if you never opened it. The gold “Complete the N closed months” button requests them for you, month by month, as if you were opening them. But only if you press it, and before you do, it tells you how many breakdowns it will read, one at a time. Those this browser already saved, from a month you opened or from Golden window, are not asked for again.

While it works, the header says which month it is completing, with a “Stop” button. What it read stays saved, so afterwards the button asks for less. If Airbnb asked it to wait, it would stop on its own, tell you why, and on this page it would not offer you the button again.
After: a sum that says what is missing
Now the header adds up “left for you”, but only for the months that have it, and it says how many are left out instead of keeping quiet about it. Next to it, the average visual occupancy (Airbnb’s goes month by month and is not averaged) and the month with the most “left for you”.

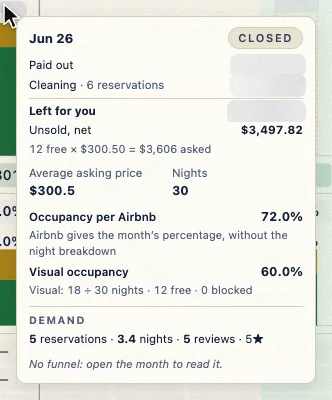
And the same month from before now has the cleaning taken out, with how many reservations go into the count. Its unsold is now net as well: minus the fee those reservations paid.
The running month and the months ahead
In the running month, what is left to sell counts from today, and the card says so. In the months ahead nothing has been paid out yet. What is there is what Airbnb has yet to pay you, which can still drop if someone cancels; the nights already booked, in pale green; and what you can still sell at today’s prices. To take the cleaning out of these months, open their Month insight: if this panel is open, it updates on its own.
Two occupancies, asking price, funnel and demand
The occupancy lane carries two figures, each with its name. On top, “Occupancy per Airbnb”: the one Airbnb works out in its performance panel, read from there month by month, never recalculated. Below, the visual occupancy, what you see on your calendar: green, booked nights; gold, free; gray, blocked, over all the nights in the month. Each divides by its own nights, so they need not match; a line in the header gives Airbnb’s figure for the last 365 days. The “Asking” row is the average price you ask per free night, and the greener, the higher.
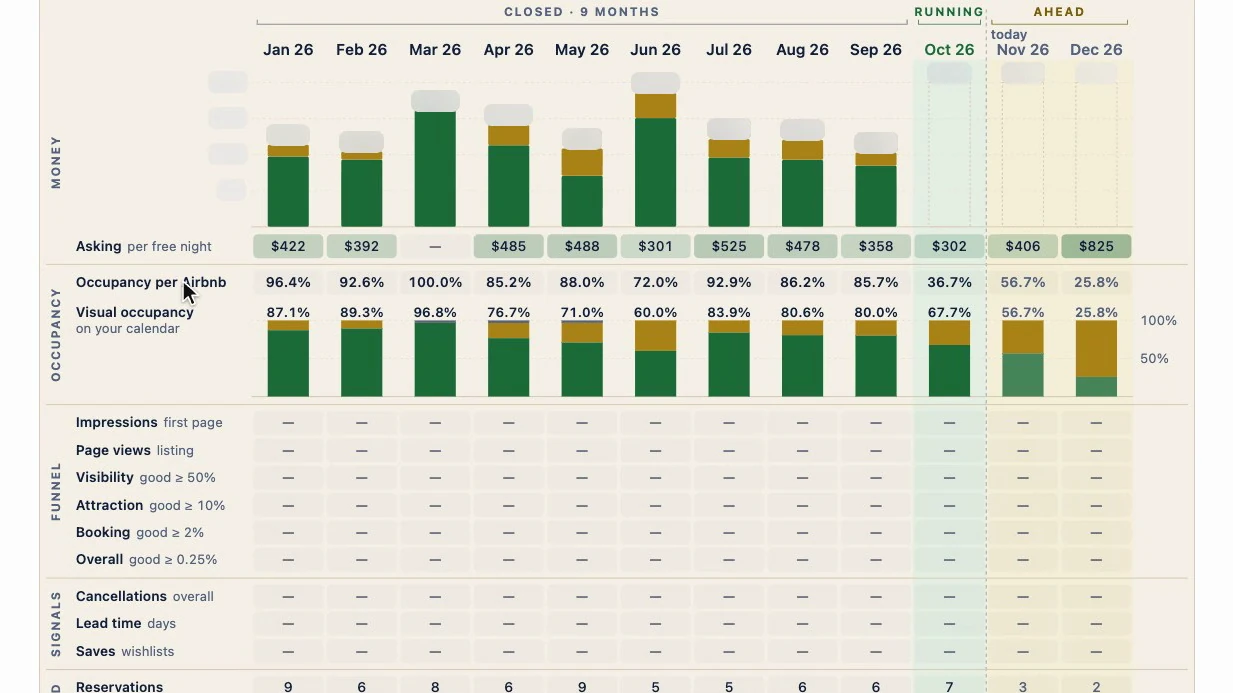
Funnel and signals show dashes, on purpose. Above the funnel’s four rates come the impressions and the page views: up to five Airbnb pages per month, only for the listing on screen, and this panel does not read them on its own. To read them, open the Funnel tab in that month’s Month insight, or press “Read the funnel of the N missing months”: it reads them one at a time and first says how many pages it costs. What it reads comes colored with the same bands Signals uses. Demand is there: reservations, counted in the month they check in, average stay, and reviews with their rating.
Why it works
Each column is its month’s receipt, with the same math as its month card: there is no second calculation that could drift. What it does not know, it shows as a gap. And the costly reads only happen when you ask for them, with the cost up front.
Its limits
- Money goes by payout date, not by stay date. There is no RevPAR here; it is in each Month insight.
- What is paid out covers your whole account: with more than one listing it does not work out “left for you”, and it tells you why.
- “Left for you” is what Airbnb pays minus the cleaning, not your profit. If you clean yourself, what is yours is Airbnb’s total.
- Funnel and signals only for the months you open, or when you press their button. The completing button only completes closed months.
- It puts one year’s months side by side, and the reading is yours. Comparing with similar listings is Market pulse’s job.